Science using Twitter: when do people see spiders?
Posted on Tue 30 September 2014 in data
It has been a mild autumn in the UK, which has led researchers to predict that we may see more spiders than usual this year. The theory goes that mild weather causes more insects to be around, which in turn implies that there is more prey for our eight-legged friends to feast on.
Judging from my own Facebook and Twitter timelines, I certainly have the impression that this prediction is accurate. In recent weeks, a significant number of my friends have been posting stories about arachnids, but is this pattern true in general? We can find out! An interesting consequence of the digitisation of our social lives is that we now have the ability to turn such anecdotal evidence into statistical samples (some might even call this data science), and I have been exploring this idea.
Spider sightings on Twitter
Over the past two years, I have been using the Twitter API to count the number of messages on the social network site that contained the word "spider" in several languages. I also obtained the meta data for each of these tweets, allowing me to determine the geographic region of each message based on the user's time zone.
The graph below shows the number of tweets originating from Britain that contained the word "spider". There have been more than 1 million of such tweets between January 2012 and now, posted by 446 000 unique users. Interestingly, the data confirm a significant seasonal variation:
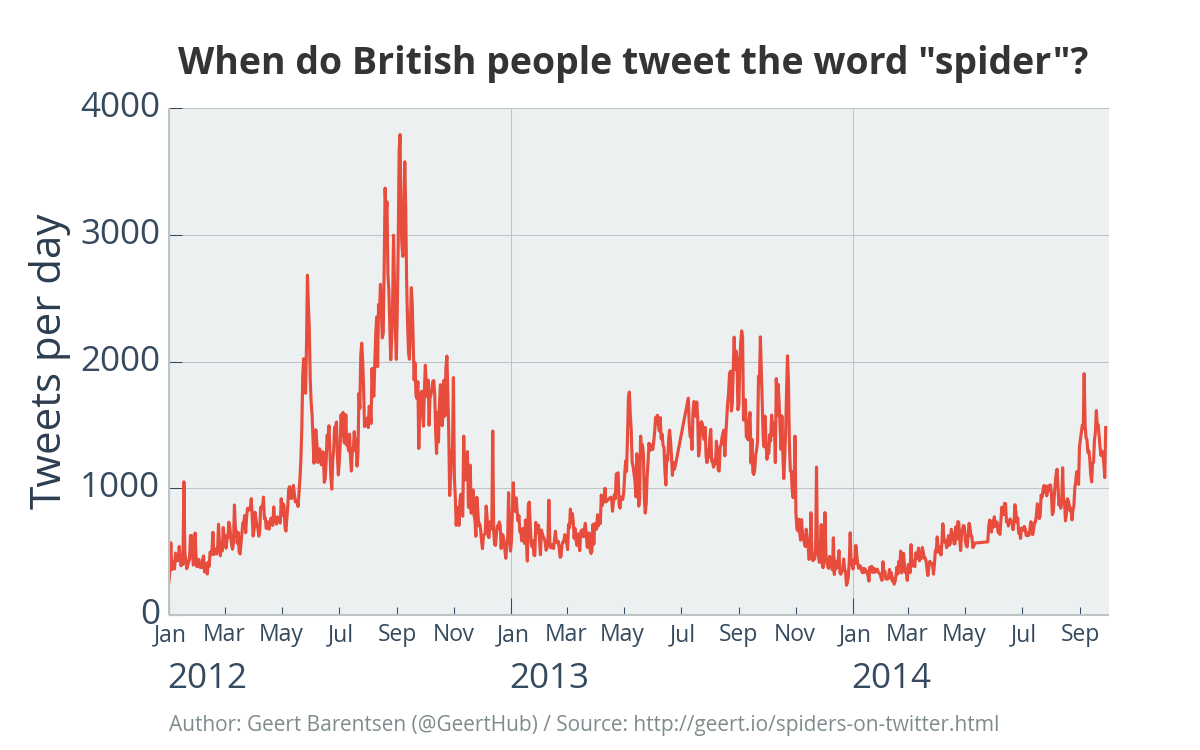
Number of tweets per day in Britain that contained the word "spider". Retweets, replies, and tweets about Spider-Man have been excluded.
The seasonal pattern is interesting because the number of tweets can be considered to be a proxy for the amount of big spiders that are running around British homes. This is of course based on the assumption that people are more likely to use the word "spider" when they have just seen one, and although some noise exists, you can easily check for yourself that it is a reasonable assumption by searching for "spider" on Twitter. Here is an example:
THERE WAS A BIG ASS SPIDER ON MY BED SO I JUMPED UP ONTO MY DRESSER IM GONNA DIE . IM TERRIFIED OF SPIDERS DAMN YOU SPIDER FUCK
— Sheℓby ∞ (@Shelbae_x3) September 22, 2014Of course not all tweets provide similar clear-cut evidence of a spider sighting. Roughly 30% of the tweets relate to the Spider-Man movies, but at the end of this post I will explain how such noise has been excluded from the statistics.
The correlation with temperature
The data above suggest that spider sightings ramp up in spring, are most common in late summer and early autumn, and become rare in winter. Although it is too early to judge whether 2014 is an exceptional year, we may already infer that British people are roughly 5 to 10 times more likely to tweet about spiders in September than in January.
This seasonal pattern is often explained in the media by a combination of three reasons:
- it is thought that some spider species head indoors once it gets cold and wet outside;
- autumn is the breeding season, which is when male spiders are known to start running around like obsessed maniacs in search for a female partner;
- autumn is also the time of the year when central heating systems are being turned on, which produces strong temperature variations that are thought to give house spiders a hormonal flush that makes them extra horny.
Because the weather appears to be a likely factor, I decided to add the mean Central England Temperature to the graph. The result is a fascinating correlation:
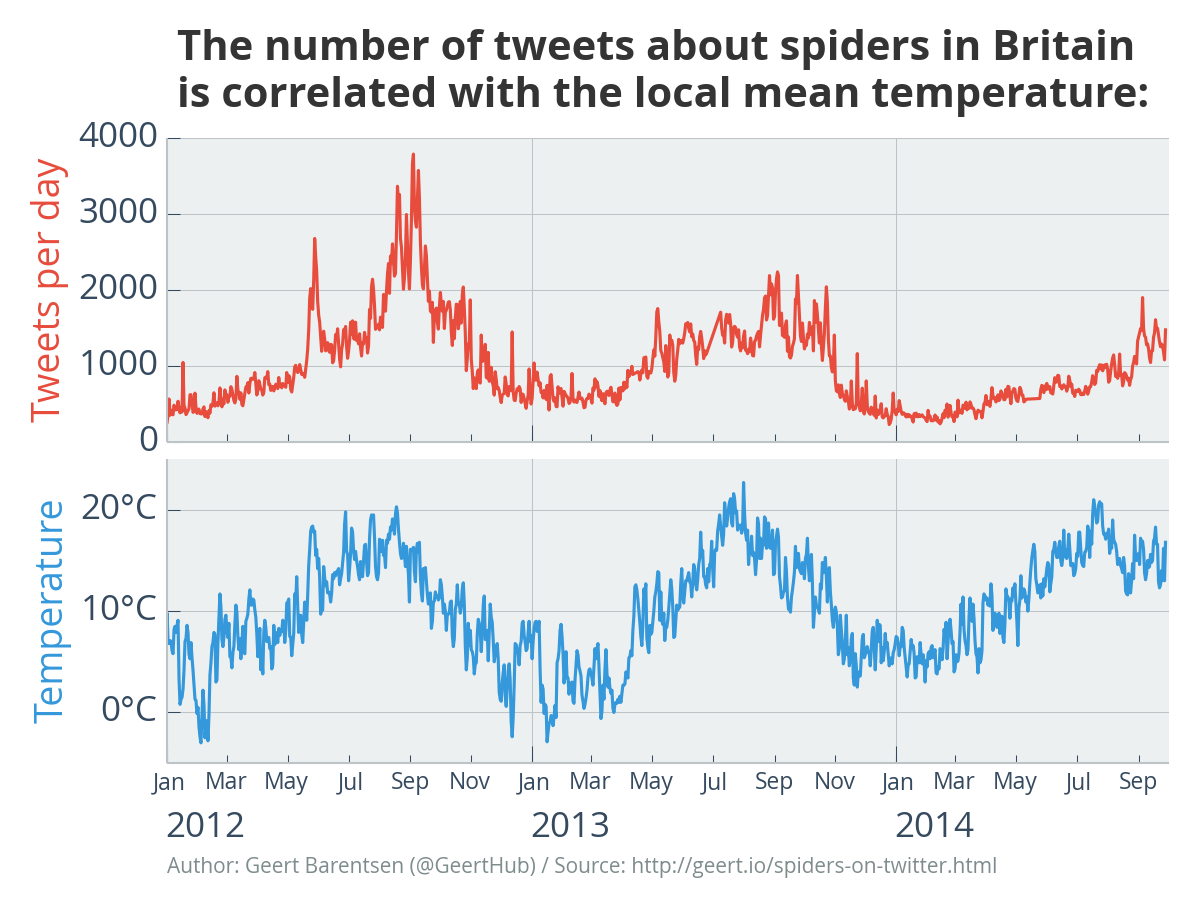
Number of British spider tweets per day (top), shown against the mean temperature in Central England obtained from the UK Met Office (bottom).
At this point I must stress that correlation does not imply causation. Although temperature is very likely to be a part of the story, the true reason for spotting more spiders in the autumn is likely to be a complicated mix of factors which include daylight times, rainfall, central heating, instincts, human behaviour, and so on. I am not troubled by any competence on this topic at all, so please post a comment below if you can elucidate the pattern for me.
The graph does point at some interesting events which warrant further investigation. For example, there appears to be an exceptional peak in both the spider activity and the temperature in May 2012. Indeed many will remember that month as being exceptionally warm across the UK. Did the unusual weather cause spiders to wake up early and leave their cosy winter webs, or was it the humans who woke up and ventured into nature? I do not know the answer to this question at present, but it is likely that the content of the tweets from that period may provide clues. I hope to analyse them in the future.
What about a different climate?
If the spider tweets are a genuine proxy for the behaviour of spiders, and if the temperature is indeed a key factor, then we may expect to see different patterns in different climates. To test this idea, I compared the average distribution of spider tweets per month between Britain and Australia. The result is once again fascinating:
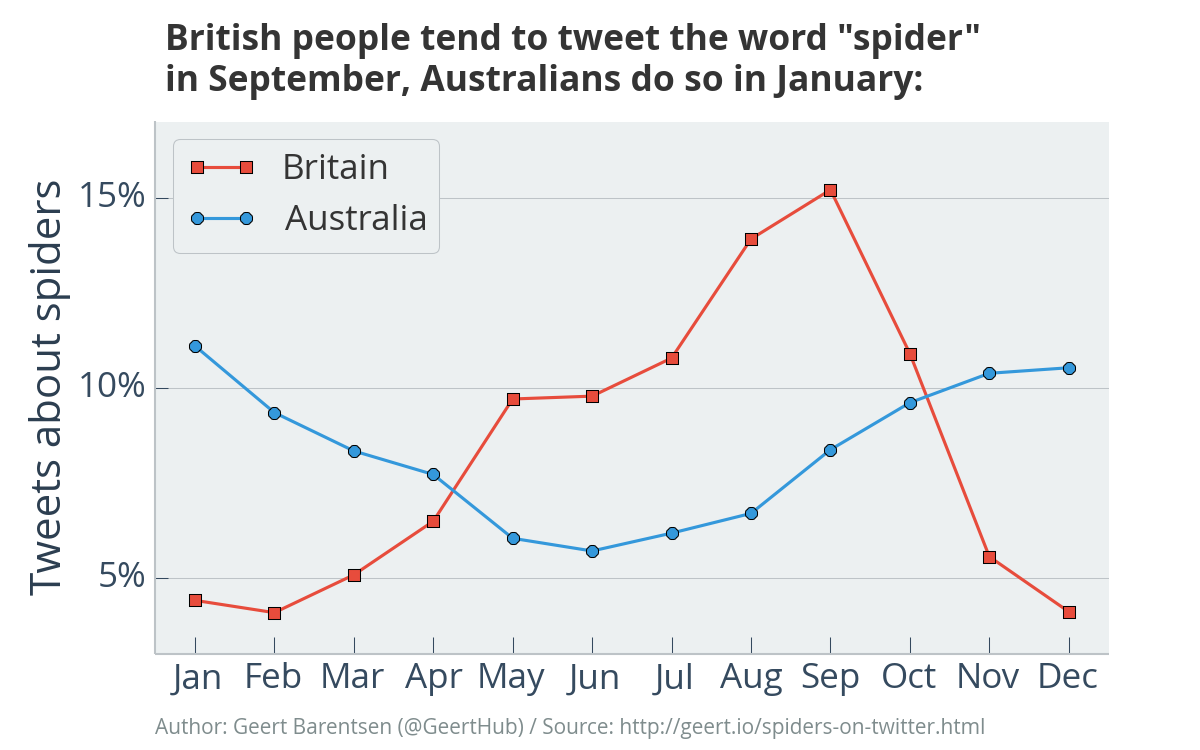
Distribution of spider tweets as a function of the month for British and Australian users of Twitter. Based on averaged data between 2012 and 2014.
The graph shows that British users appear to talk about spiders most often in September, whilst Australians do so in January. The seasonal spider pattern is less pronounced down under, which may be explained by the fact that there is less of a contrast between summer and winter temperatures in Australia. It is also possible that Australians are somewhat less likely to tweet about spiders because they are more used to them (or because they are more likely to be killed before they can tweet).
Noise and future improvements
In future work, I hope to exploit the content of the tweets using language and image analysis methods. The inclusion of text analysis would be useful because there is a fair amount of social noise when it comes to the use of the word "spider". To create the graphs shown above, I decided to apply a simple noise filter as follows:
- retweets and replies were excluded to reduce the impact of media stories and celebrities;
- tweets about Spider-Man were ignored by excluding tweets containing the word "man" (amounting to 30% of the data set);
- tweets about the viral Mutant Giant Spider Dog video on YouTube were ignored by excluding tweets containing the word "mutant" (1% of the data set).
Moreover, I decided to exclude a few specific days which were dominated by tweets about celebrities. I removed the data for:
- 24 Apr 2013: because a member of One Direction instagrammed a spider;
- 13 Nov 2012: because a politician ate a baked spider on TV;
- 19 May 2012: because the haircut of a football player featured a spider.
Although this simple noise filter can no doubt be improved, a manual inspection of randomly selected tweets leads me to believe that the vast majority of the remaining sample relates to genuine spider sightings.
Conclusions
Human mankind is the biggest and most powerful sensor network on this planet, and social media allows us to exploit their observations more efficiently than ever before. In this post I used more than 1 million tweets from 446 000 unique users to gain insights into the behaviour of spiders in Britain (and the humans that encounter them). I found that people are 5 to 10 times more likely to tweet about spiders in late autumn than in winter. This pattern likely corresponds to a true increase in the number of encounters between spiders and humans, and appears to correlate strongly with the local mean temperature.
I am unable to distribute the data set because I would likely get into trouble with Twitter. However, if you are familiar with the scientific literature on spiders (which I am not), and if you would like to help me turn this data into a paper, then please get in touch or leave a comment below.
The tools used to create these graphs are Amazon EC2 (for collecting the tweets), Python (parsing), SQLite (data exploration and statistics), and matplotlib (visualisation) using a custom configuration file.