219 million stars: our new atlas of the visible Milky Way
Posted on Tue 16 September 2014 in astronomy
Over the past decade, my colleagues and I have been working very hard on a mission to create the most detailed atlas ever made of the visible part of our home galaxy, the Milky Way. The result of this labour is a brand new catalogue detailing the properties of no fewer than 219 million stars. The work was officially published published in the journal MNRAS today. It is also the topic of a press release by the Royal Astronomical Society, which describes the project in great clarity and includes this beautiful excerpt of our map:
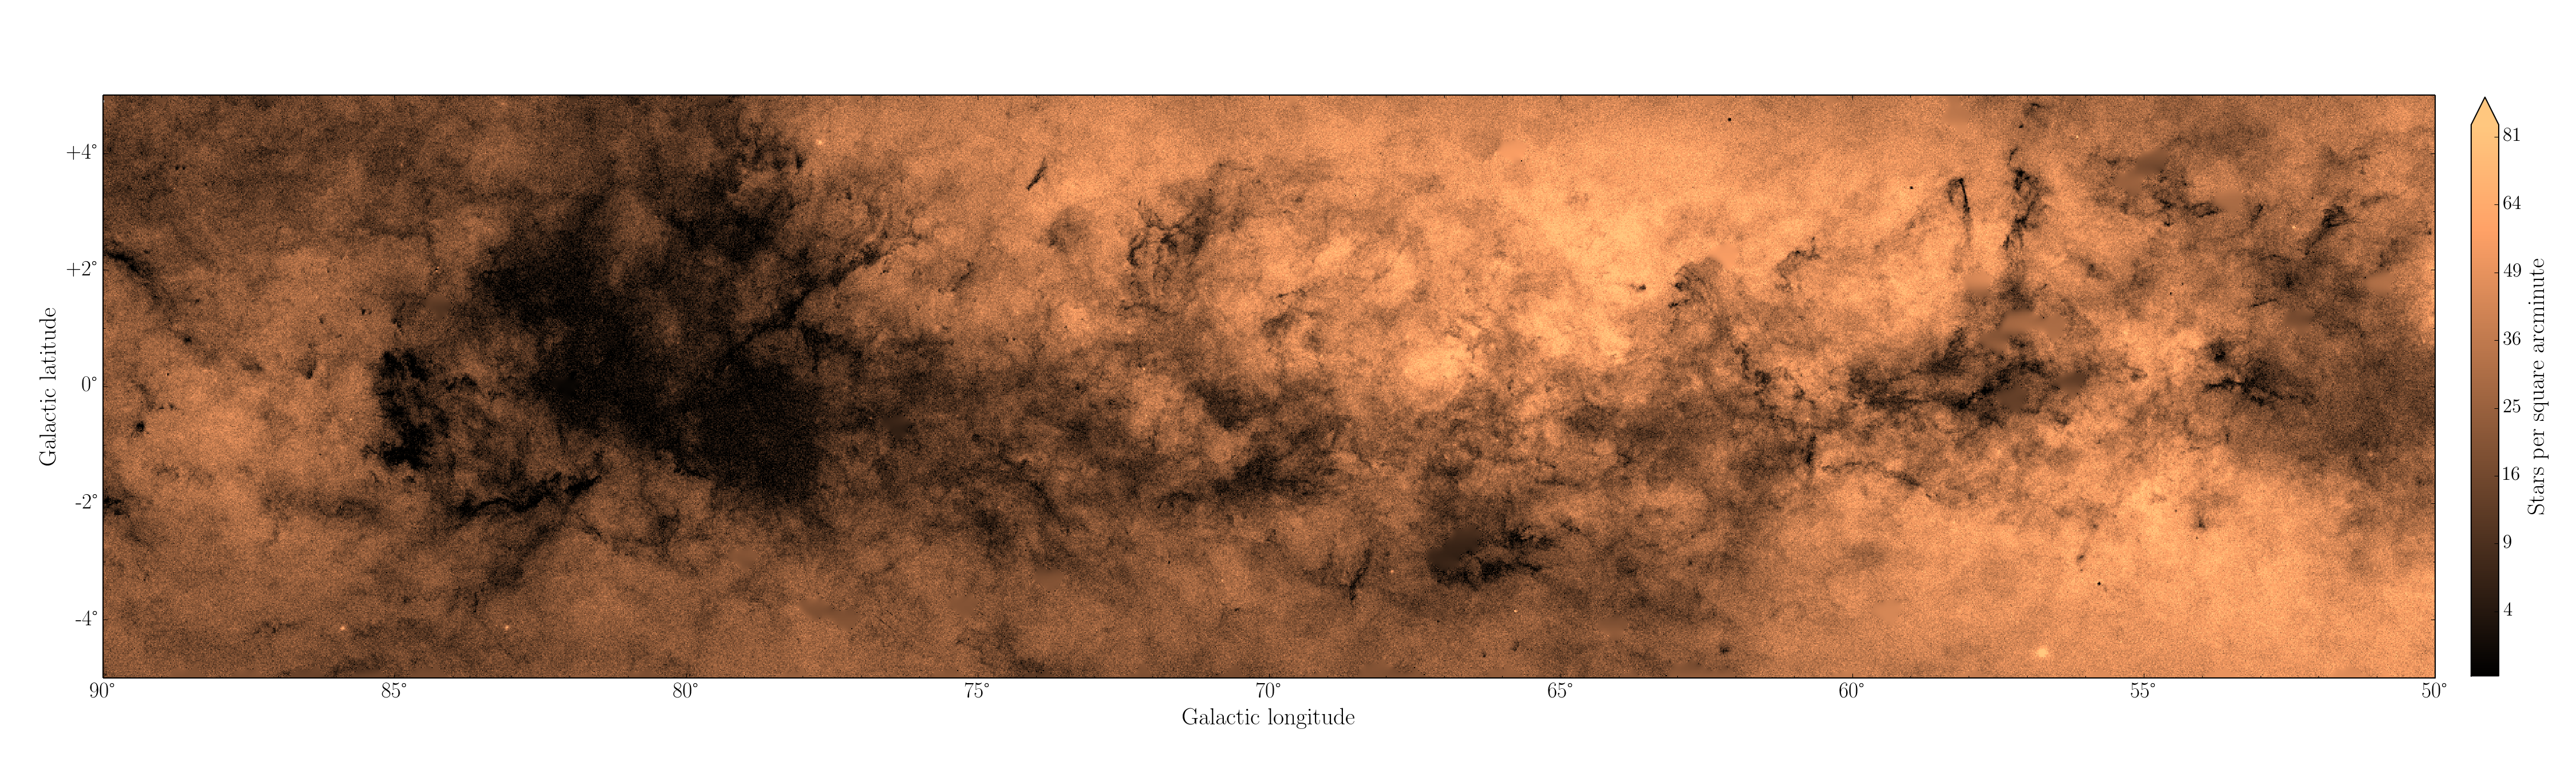
A density map of part of the Milky Way disk, mined directly from the new catalogue by one of our talented PhD students, Hywel Farnhill. Click on the image for a very large version.
Lots and lots of telescope images
Our new map is the result of a collaboration between an international team of astronomers, named the INT Photometric H-Alpha Survey (IPHAS), which is led by my manager Prof Janet Drew at the University of Hertfordshire. The project uses the 2.5-meter mirror of the Isaac Newton Telescope (INT) on the island of La Palma to take very detailed images of the Milky Way across a band of 180-by-10 degrees in the sky. This allows us to capture all the stars brighter than 20th magnitude -- a million times fainter than can be seen with the human eye.
The sensitive detectors of the telescope's camera provided us with more than 250 000 detailed CCD frames of the Milky Way so far, at a resolution of 8 megapixel each. It took more than 350 nights at the telescope, spread over a period of 10 years, to obtain these data. Interestingly, all these nights were obtained in so-called open access time, which means that we had to compete with other projects every semester to gain access to the telescope.
To offer a sense of the insane amount of data collected by the survey, I uploaded a 6-hour movie to YouTube which showcases all the images obtained so far. The movie proceeds at a rate of one colour mosaic per second:
Each image in the movie corresponds to a single pointing of the telescope towards the Milky Way. The frames shown are colour mosaics composed of the four CCD detectors that make up the telescope's L-shaped camera. Each detector consists of 2048-by-4100 pixels, covering 0.2-by-0.4 degrees on the sky, but the resolution of the movie was of course reduced significantly prior to upload. The colour mosaics are composed of exposures obtained separately using an H-alpha filter (red channel), an r-band filter (green channel), and an i-band filter (blue channel).
The movie is an uncut version of all the data, i.e. it includes images obtained under poor conditions. For example, clouds in the atmosphere can occasionally be seen to cause very bright and colourful frames with very few stars. Such poor data have of course been flagged and re-observed as part of the quality control procedures which we developed. As well as carrying out several automated checks, yours truly carefully inspected all the images by eye.
From images to catalogue
Astronomers rarely use images directly to study the contents of our Galaxy. Instead, they prefer to use catalogues in which the properties of all the stars are listed in a convenient tabular format. Constructing such a catalogue is a big data job, because it required the thousands of stars in each of the 250 000 CCD frames to be painstakingly measured. Needless to say, this required a high-performance supercomputer along with purpose-built software (for which the Cambridge Astronomical Survey Unit deserves much of the credit). Fortunately, I was able to benefit from my experience in computing to carry out the task: I obtained an MSc in computer science prior to getting a PhD in astrophysics. That is, I am a bit of an intruder in astronomy, though the official term for that is data scientist these days!
The catalogue, which is 50 GB in size after data compression, is available for download from our project website and can be queried online through the Vizier data portal. In the near future, I will be blogging examples showing how the data may be accessed and exploited.
Why we are excited
A unique feature of our survey is the use of a narrow-band filter which captures the brightest hydrogen emission line, H-alpha. If we detect a strong signature of H-alpha emission towards a star, it tells us that the object is likely to be very young or very old, because that is when stars tend to be surrounded by diffuse ionized gas. Such pre- or post-main-sequence stars represent relatively short-lived phases of stellar evolution and are hence hard to find amongst the vast majority of "normal" main sequence stars that populate our mature Galaxy. Our catalogue will allow far more of these young and old objects to be discovered, which is necessary to develop and test models for these crucial stages in the life of a star. We have already identified several hundreds of previously unknown objects in the catalogue which are likely to be very young or old,and have started studying them in more detail.
We are also excited to share this new data with the rest of the world for another reason: whenever large data sets have been released in the past, astronomers have always come up with new and creative methods to use it in ways which were not originally envisaged by the authors. We hope this will be no different for our catalogue, and look forward to new and serendipitous discoveries being made. In particular, IPHAS data complements the work of ESA's recently launched Gaia mission, that will start releasing data from 2016.